Please refer to important disclosures at the end of this report
1
1
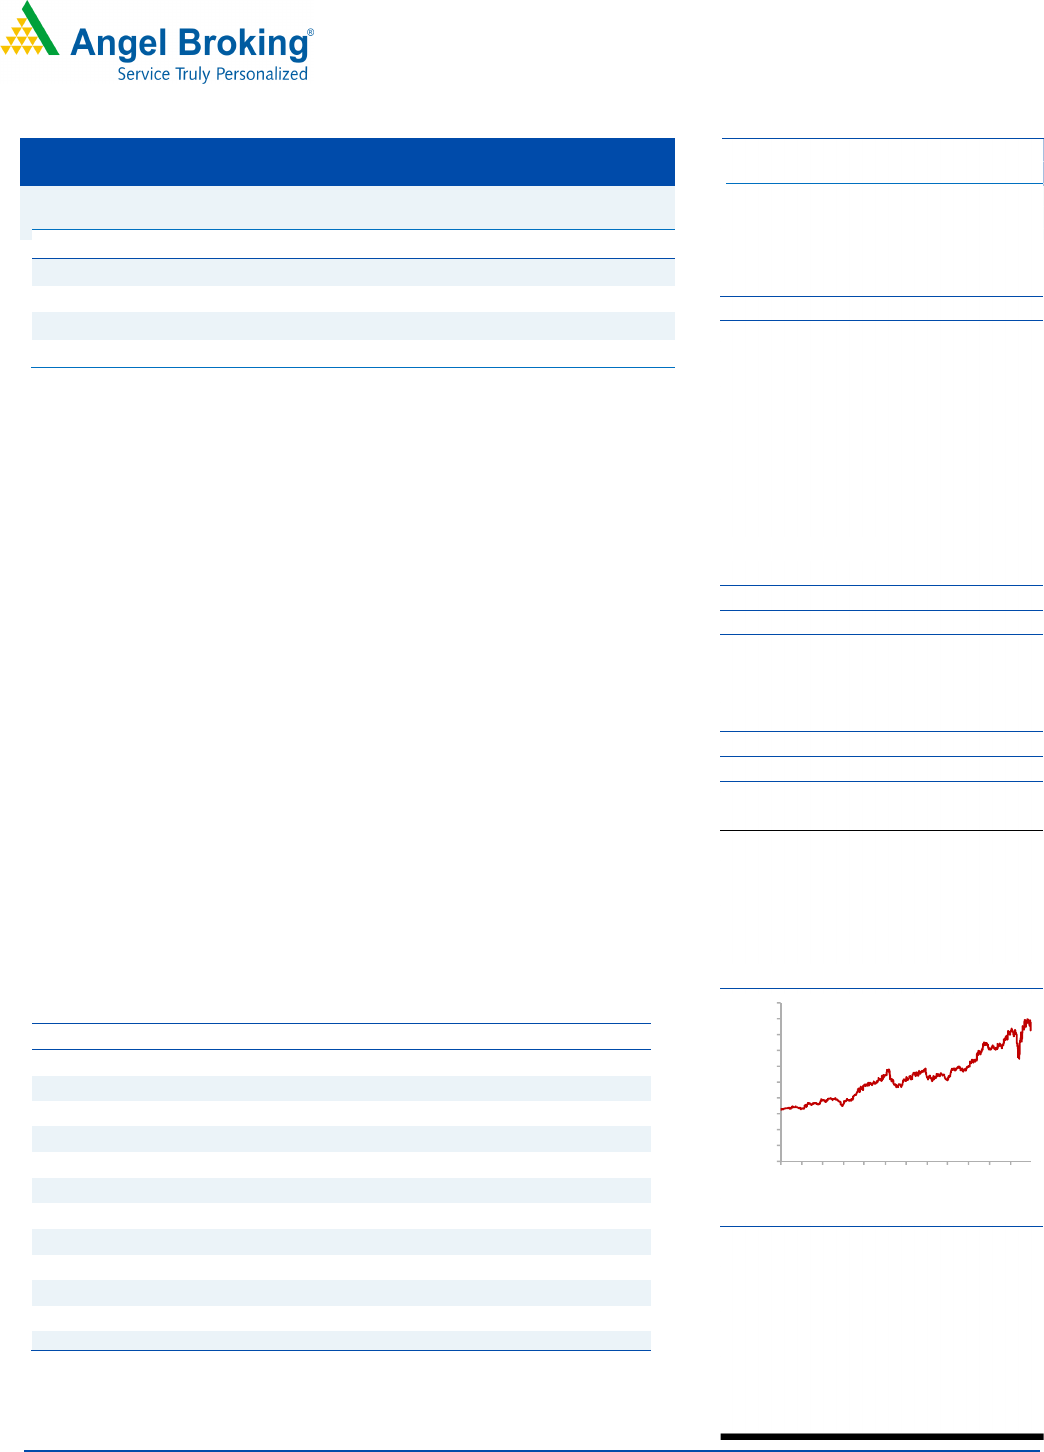
(` cr)
1QCY20
1QCY19
% yoy
4QCY19
% qoq
Revenue
3,325
3,003
10.7
3,149
5.6
EBITDA
793
753
5.4
694
14.3
OPM (%)
23.9
25.1
(121bp)
22.0
182bp
Reported PAT
525
463
13.5
473
11.2
Source: Company, Angel Research
For 1QCY20, Nestle India Ltd (NIL) posted healthy
set of numbers, exceeding our
expectations on top-line and bottom-line fronts
. Revenue grew by ~11% yoy.
However, reported operating margins contracted by 121bps yoy. On the bottom
-
line front, NIL reported growth of ~14% yoy to `525
cr on the back of healthy
revenue growth and lower taxes.
Top-line grew ~11% yoy: Nestle’s top-line grew by ~11% yoy to `3,325cr driven
by
volumes and mix, implying double-digit volume growth
. Maggi and chocolates
recorded strong performance. E-commerce contribution grew significantly,
whereas
out of home sector performance was subdued. Duri
ng the quarter, exports grew by
~13%.
PAT grew ~14% yoy: On the operating fr
ont, the company reported margin
contraction, down 121bps yoy on the back of higher
prices of milk and other agri
inputs. Going forward, we expect operating margin improvement on back of
recent
softening in milk prices and other inputs, decline
in competitive intensity and
measures for cost efficiencies. On the bottom-
line front, NIL reported growth of
~14% yoy to `525cr on the back of back of healthy revenue growth and lower taxes.
Outlook and Valuation: We forecast Nestle to report healthy top-line CAGR of ~9
%
to `14,558cr over CY2019-21E on the back of
strong brand, wide distribution
network and new product launches. On the bottom-line front
(reported PAT), we
estimate ~10% CAGR to `2,333cr due to strong revenue and
gradual improvement
in operating margin. Thus, we maintain BUY on the stock with Target
Price of
`19,100.
Key Financials
Y/E March (` cr)
CY2018 CY2019
CY2020E
CY2021E
Net sales 11,292 12,369 13,235 14,558
% chg 12.8 9.5 7.0 10.0
Adj. Net profit 1,607 1,970 2,091 2,333
% chg 31.2 22.6 6.2 11.6
EBITDA margin (%) 23.2 23.2 22.7 23.3
EPS (`) 166.7 204.3 216.9 242.0
P/E (x) 98.6 80.4 75.8 67.9
P/BV (x) 43.1 33.2 26.4 21.2
RoE (%) 43.7 41.2 34.9 31.3
RoCE (%) 61.5 52.8 44.1 40.4
EV/Sales (x) 13.7 12.4 11.5 10.4
EV/EBITDA (x)
58.9
53.6
50.6
44.4
Source: Company, Angel Research
BUY
CMP `16,370
Target Price `19,100
Investment Period 12 months
Stock Info
Sector FMCG
Market Cap (` cr) 1,61,196
Net Debt (` cr)
(4,200)
Beta 0.5
52 Week High / Low 18,301/10,225
Avg. Daily Volume 5,117
Face Value (`) 10
BSE Sensex 31,405
Nifty 9,221
Reuters Code NEST.BO
Bloomberg Code NEST.IN
Shareholding Pattern (%)
Promoters
62.8
MF / Banks / Indian
9.1
FII / NRIs / OCBs
12.2
Indian Public/Others
16.0
Abs.(%) 3m 1yr 3yr
Sensex (22.8)
(13.7) 5.6
NIL 0.6 60.1 149.9
Historical share price chart
Source: Company, Angel Research
Amarjeet S Maurya
022-40003600 Ext: 6831
amarjeet.maurya@angelbroking.com
Nestle India Ltd
Performance Update
0
2000
4000
6000
8000
10000
12000
14000
16000
18000
20000
May-17
Aug-17
Nov-17
Feb-18
May-18
Aug-18
Nov-18
Feb-19
May-19
Aug-19
Nov-19
Feb-20
1QCY20 Result Update | FMCG
May 14, 2020

Nestle India | 1QCY2020 Result Update
May 14, 2020
2
1QCY20 Performance
Y/E March (` cr) 1QCY20 1QCY19
% yoy
4QCY19 % qoq
CY2019
CY2018
% chg
Net Sales
3,325
3,003
10.7
3,149
5.6
12369 11292
9.5
Consumption of RM 1453 1245
16.7
1361
6.7
5223
.9
4,590
13.8
(% of Sales)
43.7
41.5
43.2
42.2
40.6
Staff Costs
358.4
301.8
18.7
322
11.3
1258.2
1124.2
11.9
(% of Sales)
10.8
10.1
10.2
10.2
10.0
Other Expenses
720.3
703.1
2.4
772
(6.7)
2,961
2,960
0.0
(% of Sales)
21.7
23.4
24.5
23.9
26.2
Total Expenditure
2,532
2,250
12.5
2,455
3.1
9,443
8,675
8.9
Operating Profit
793
753
5.4
694
14.3
2,926
2,618
11.8
OPM
23.9
25.1
22.0
23.7
23.2
Interest 41 34
20.8
31
31.6
129
112
15.3
Depreciation 91 91
(0.0)
94
(2.4)
370
336
10.3
Other Income
43
73
(41.5)
45
(4.1)
247
259
(4.7)
PBT (excl. Ext Items)
704
701
0.5
614
14.6
2,673
2,429
10.1
Ext (Income)/Expense
-
-
-
-
-
PBT (incl. Ext Items)
704
701
0.5
614
14.6
2,673
2,429
10.1
(% of Sales)
21.2
23
.3
19.5
21.6
21.5
Provision for Taxation
178.4
237.9
(25.0)
141
26.1
705
822
(14.2)
(% of PBT)
25.3
34.0
23.0
26.4
33.8
Reported PAT
525
463
13.5
473
11.2
1,968
1,607
22.5
PATM
15.8
15.4
15.0
15.9
14.2
Minority Interest After NP
Reported PAT
525
463
13.5
473
11.2
1,968
1,607
22.5
Source: Company, Angel Research

Nestle India | 1QCY2020 Result Update
May 14, 2020
3
Outlook and Valuation
We forecast Nestle to report healthy top-line CAGR of ~9% to `14,558cr over
CY2019-21E on the back of strong brand, wide distribution network and new
product launches. On the bottom-line front (reported PAT), we estimate ~10% CAGR
to `2,333cr due to strong revenue and gradually improvement in operating margin.
Thus, we maintain BUY on the stock with Target Price of `19,100.
Downside risks to our estimates
Volatile milk prices: Increase in milk prices will have a negative impact on the
company’s performance.
Economic slowdown: Economic slowdown will affect the performance of the
company.
Competition: Losing market share due to stiff competition could impact the
profitability of company.
Company Background
Nestle India Ltd (Nestle) manufactures and sell a variety of food products such as
Milk Products and Nutrition, Prepared dishes and Cooking aids, Powdered and
Liquid Beverages and Confectionery. Nestle has market leadership in ~85% of
Portfolio. Wide distribution network (4.6mn outlets) across the Indian and Strong
brand recall.

Nestle India | 1QCY2020 Result Update
May 14, 2020
4
Research Team Tel: 022
-
39357800 E
-
mail: research@angelbroking.com Website: www.angelbroking.co
m
DISCLAIMER
Angel Broking Limited (hereinafter referred to as “Angel”) is a registered Member of National Stock Exchange of India Limited, Bombay
Stock Exchange Limited and Metropolitan Stock Exchange Limited. It is also registered as a Depository Participant with CDSL and Portfolio
Manager and Investment Adviser with SEBI. It also has registration with AMFI as a Mutual Fund Distributor. Angel Broking Limited is a
registered entity with SEBI for Research Analyst in terms of SEBI (Research Analyst) Regulations, 2014 vide registration number
INH000000164. Angel or its associates has not been debarred/ suspended by SEBI or any other regulatory authority for accessing
/dealing in securities Market. Angel or its associates/analyst has not received any compensation / managed or co-managed public
offering of securities of the company covered by Analyst during the past twelve months.
This document is solely for the personal information of the recipient, and must not be singularly used as the basis of any investment
decision. Nothing in this document should be construed as investment or financial advice. Each recipient of this document should make
such investigations as they deem necessary to arrive at an independent evaluation of an investment in the securities of the companies
referred to in this document (including the merits and risks involved), and should consult their own advisors to determine the merits and
risks of such an investment.
Reports based on technical and derivative analysis center on studying charts of a stock's price movement, outstanding positions and
trading volume, as opposed to focusing on a company's fundamentals and, as such, may not match with a report on a company's
fundamentals. Investors are advised to refer the Fundamental and Technical Research Reports available on our website to evaluate the
contrary view, if any
The information in this document has been printed on the basis of publicly available information, internal data and other reliable sources
believed to be true, but we do not represent that it is accurate or complete and it should not be relied on as such, as this document is for
general guidance only. Angel Broking Limited or any of its affiliates/ group companies shall not be in any way responsible for any loss
or damage that may arise to any person from any inadvertent error in the information contained in this report. Angel Broking Limited
has not independently verified all the information contained within this document. Accordingly, we cannot testify, nor make any
representation or warranty, express or implied, to the accuracy, contents or data contained within this document. While Angel Broking
Limited endeavors to update on a reasonable basis the information discussed in this material, there may be regulatory, compliance, or
other reasons that prevent us from doing so.
This document is being supplied to you solely for your information, and its contents, information or data may not be reproduced,
redistributed or passed on, directly or indirectly.
Neither Angel Broking Limited, nor its directors, employees or affiliates shall be liable for any loss or damage that may arise from or in
connection with the use of this information.
Ratings (Returns): Buy (> 15%) Accumulate (5% to 15%) Neutral (-5 to 5%)
Reduce (-5% to -15%) Sell (< -15%)
Disclosure of Interest Statement
Nestle India
1. Financial interest of research analyst or Angel or his Associate or his relative No
2. Ownership of 1% or more of the stock by research analyst or Angel or associates or relatives No
3. Served as an officer, director or employee of the company covered under Research No
4. Broking relationship with company covered under Research No